Sample TWO - a (horizontal) bar graph
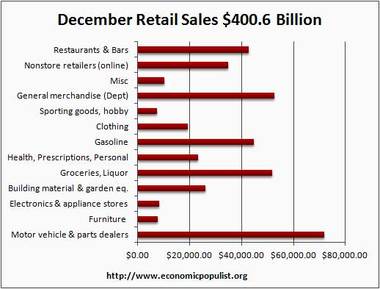
This bar graph shows the total retail sales for one month in a country. The sales are categorized into thirteen different areas and the figures range from under $10 000 to over $70 000.
The least amount of money was spent on sporting and leisure goods, followed closely by electronics and appliances, and furniture. This is surprising as some of these goods have high price tags. Each of these three areas made under $10 000. The category of miscellaneous items comes next, at just over $10 000. In the middle of the expenditure amounts are the areas of clothing, medical or personal, and building material including garden equipment. The approximate average spent on these three was $21 000.
The largest area on which people spent their money was motor vehicles and parts. This category far exceeded all others, reaching over $70 000. Other large areas of spending during this month included dining out, gasoline, groceries and liquor, and general merchandise, ranging from around $42 000 to $52 000.
The most interesting thing, however, about these December sales figures is that online purchases are becoming competitive with retailers, at $37 000.
190 words
TIPS
1. The first paragraph provides an overview of the graph, including the overall range.
2. Use 'from' and 'to' with the VERB 'range' - "the figures range from ____ to ____"
3. When there is a large number of categories, try to group them. I grouped them like this.
- lowest sales (Sporting goods, Electronics, Furniture
- Miscellaneous
- medium sales (Clothing, Health, Building)
- high sales (Restaurants, Gasoline, Groceries, General Merchandise)
- extremely high sales (Motor Vehicle and Parts)
4. Use comparative grammar structures
- the least amount
- the largest area on which people spent their money
- exceeded
5. Sometimes you can close your text with an interesting comment, which is what I've shown in this example.
